Production decision guide

Packaging line bottleneck calculator

Compare station rates, identify the lowest sustained capacity and estimate the daily output lost against a target rate.

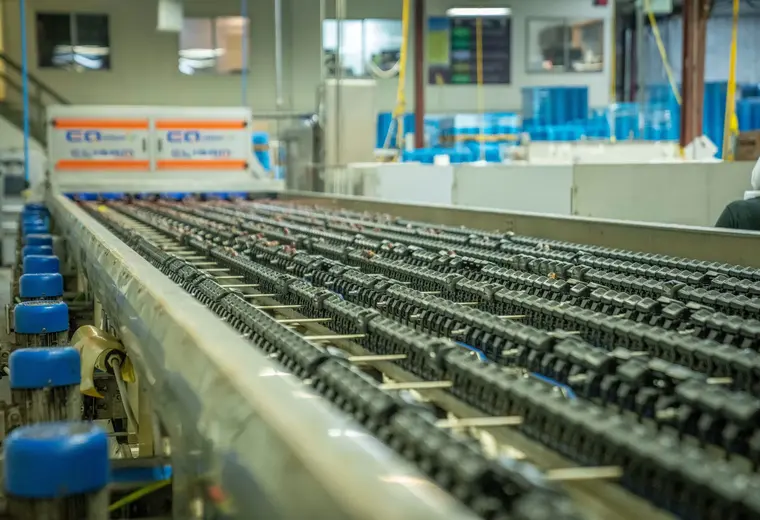
Production environment relevant to packaging line bottleneck calculator

What this calculator measures

The lowest sustained station rate is a starting estimate of line capacity. Actual output can be lower when starvation, blockage, micro-stops, changeovers and quality losses are included.

Your result

Enter the production figures and select Calculate result.

How to use the result

  1. Measure sustained rates using representative product and normal replenishment.
  2. Record blocked and starved time for each station.
  3. Do not use catalogue maximums as sustained capacity.
  4. Test whether accumulation changes the constraint before replacing equipment.
Planning estimate: This tool does not create a quotation, legal quantity-control target, guaranteed OEE or investment approval. Validate the inputs against actual production.
Relevant specialist route

Packaging Conveyors

Conveyors, transfers and accumulation for stabilising flow between line stations.

View the solutionpackagingconveyors.co.uk
Calculator questions

Questions customers also ask

Is the slowest machine always the bottleneck?

Not always. A faster machine with frequent micro-stops, poor feeding or long changeovers can constrain the line more than a slower stable machine.

How does accumulation affect a bottleneck?

Accumulation can decouple short stops and protect the constraint, but it does not increase the long-term capacity of a genuinely slower process.

What data is needed for bottleneck analysis?

Good counts, running time, blocked time, starved time, faults, changeovers and product-format information are the minimum useful set.

Should manual tasks be treated as stations?

Yes. Loading, inspection, replenishment and case packing can be the real constraint and should be timed like machine stations.

Ask a question