Production decision guide

Packaging line OEE calculator

Calculate availability, performance, quality and overall equipment effectiveness for a packaging or production line.

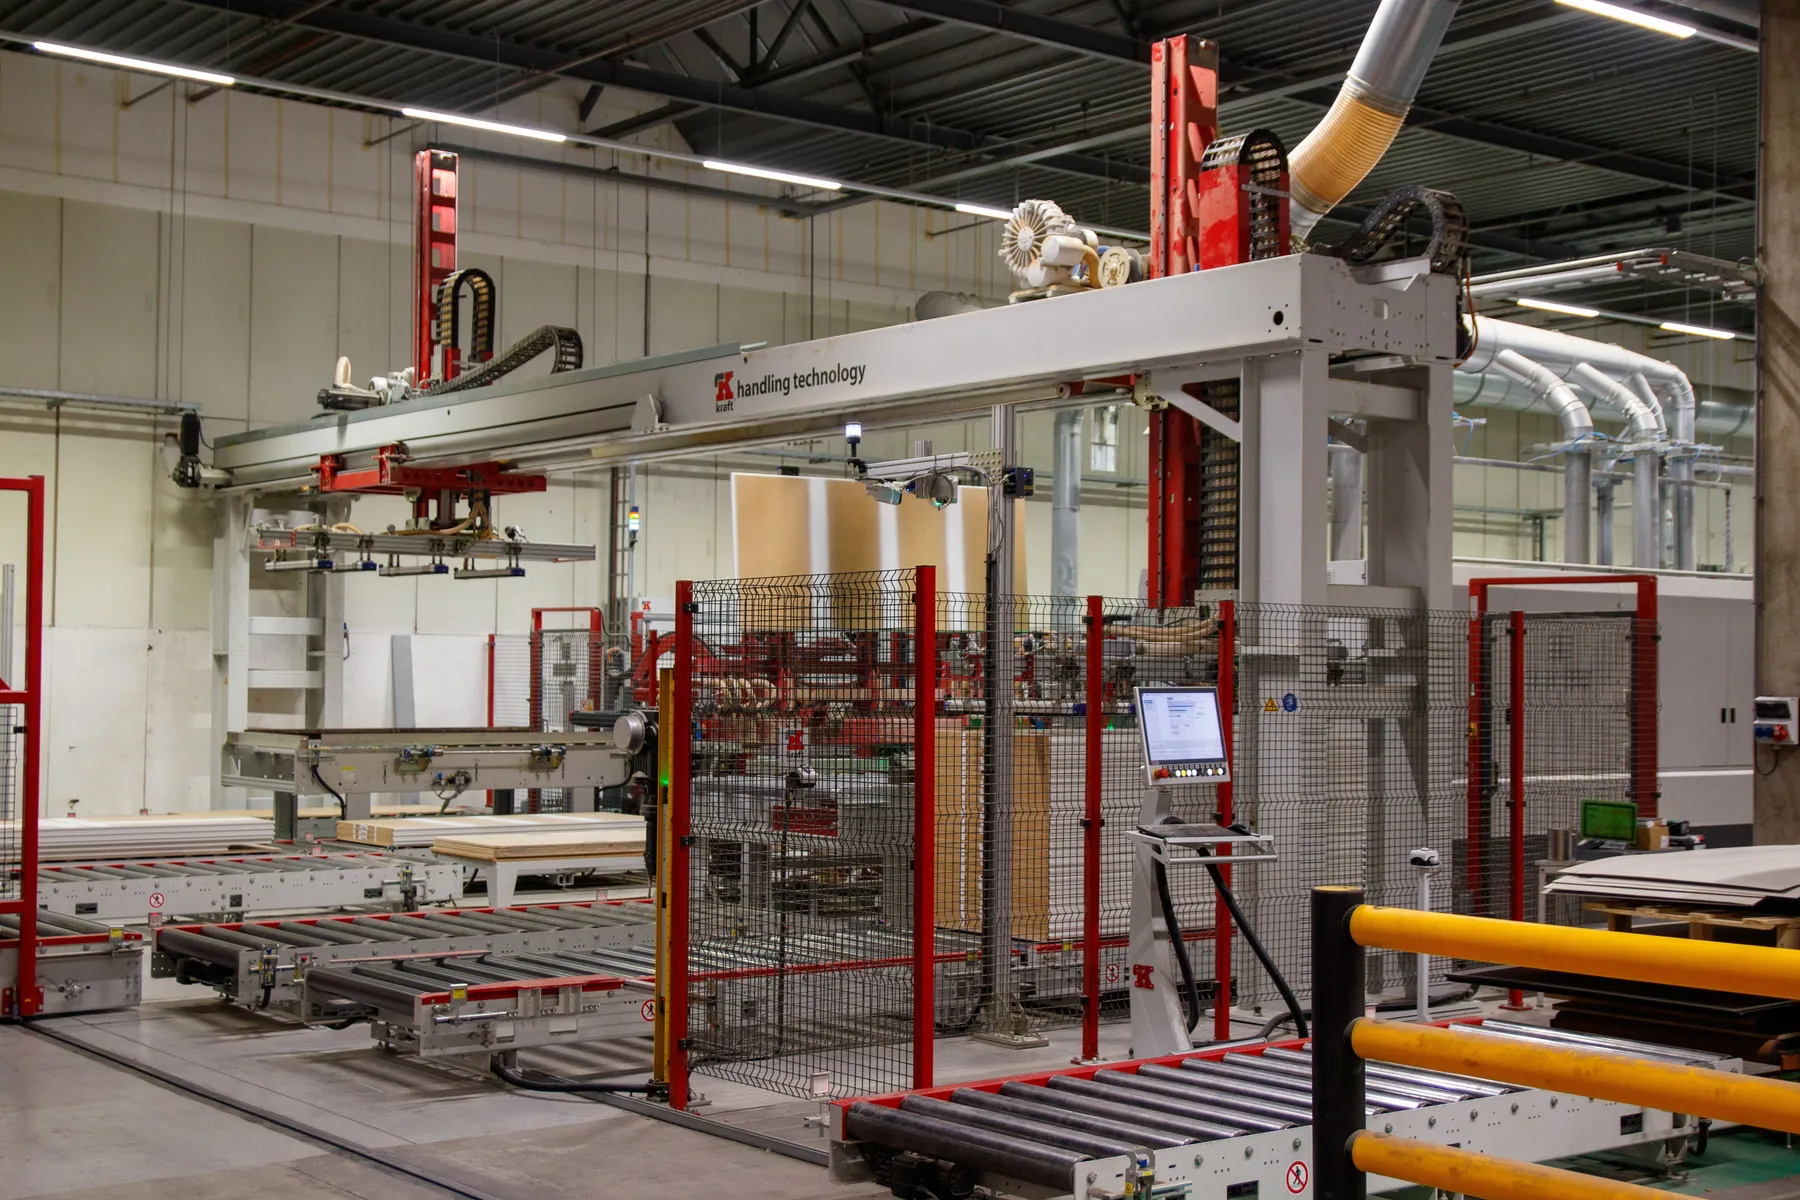
Production environment relevant to packaging line oee calculator

What this calculator measures

OEE combines availability, performance and quality. It helps separate lost time, reduced speed and quality loss instead of treating all output shortfall as one problem.

Your result

Enter the production figures and select Calculate result.

How to use the result

  1. Use a representative scheduled production period, not a short best-case run.
  2. Count only unplanned stop time in the availability calculation; planned breaks should be handled consistently.
  3. Use the demonstrated ideal cycle time for the product and format being measured.
  4. Count good units that meet the agreed finished-pack standard without rework.
Planning estimate: This tool does not create a quotation, legal quantity-control target, guaranteed OEE or investment approval. Validate the inputs against actual production.
Relevant specialist route

Packaging Automation UK

Automation and line-integration routes for improving measured output.

View the solutionpackagingautomationuk.co.uk
Calculator questions

Questions customers also ask

What is a good OEE for a packaging line?

A useful benchmark depends on product mix, changeover, hygiene and process complexity. Use OEE first to identify the largest loss category, then compare the same line against itself over time.

Why can OEE be misleading?

It can be misleading when planned time, ideal cycle time or good-unit definitions change. Keep those definitions stable and review the underlying availability, performance and quality values.

Should changeovers be included in OEE?

Include them consistently according to the planned production-time definition. For improvement work, track changeover time separately even if it is treated as planned loss.

How often should OEE be calculated?

Daily or by shift is useful for operational control; weekly and monthly trends help show whether improvements are sustained.

Ask a question